Background
In the global game of one-upmanship, there is no better friend than data. Gita Wirjawan, now Indonesia’s Trade Minister, understands how performance is improved through competitive pressure. This was his motivation early in 2012, for coming to the Asia
Competitiveness Institute (ACI) at the Lee Kuan Yew School of Public Policy to discuss how the 33 provinces of Indonesia can engage in friendly competition with one another.
He wanted them to vie for the spot of “best-performing” province.
ACI had already done similar work in the 34 Greater China Economies, 35 States and Federal Territories of India, and the 10 countries of ASEAN. It took one year, travels to all 33 provinces, and many intense conversations, before ACI was ready with its
analysis. In February 2013, the English version of the book capturing its key findings was launched in Singapore. The Indonesian edition was launched in Jakarta in June 2013 by the Coordinating Ministry of Economic Affairs, Republic of Indonesia, together
with the Indonesian Employers Association (APINDO).
Competitiveness Analysis: ACI’s Approach
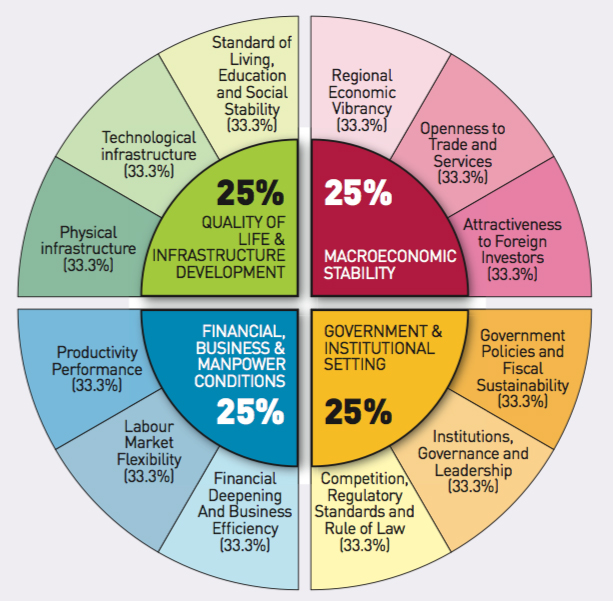
The ACI adopts a comprehensive view of competitiveness. Here a province is said to have high “overall competitiveness” if it has robust macroeconomic foundations, a vibrant private sector, inclusive, effective and efficient governance, and a high quality
of life that includes excellent infrastructure. ACI’s overall competitiveness index is broken down into four “environments”: 1) macroeconomic stability, 2) government and institutional setting, 3) financial, business and manpower conditions, and 4)
quality of life and infrastructure development. Each environment is further broken down into three “sub-environments”, such that the overall competitiveness index is composed of 12 sub-environments. Overall, the ACI uses 91 unique indicators. About
60% of these are sourced from the national statistics agency for the latest official data available (year 2010), while the rest are generated from surveys with local business owners, academics, and provincial government officials.
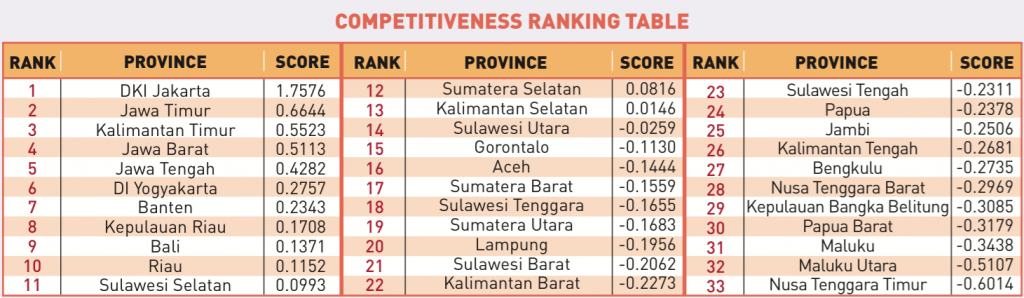
How to Read the Competitiveness Ranking Table
Each of ACI’s indicators has a unique unit of measurement. For example, the province’s GDP is measured in millions of Rupiah, while the length of paved roads is measured in kilometres. To resolve these differences and enable the indicators to be aggregated
according to their sub-environment and environment, a statistical technique called standardised score is utilised. The standardised score measures the relative performance of a certain province in comparison to the average performing province, regardless
of the unit of measurement. Thus a province which has a standardised score of zero can be said to be an ‘average performer’, while those which have positive scores are above-average performers, and those with negative scores perform below average. The
ranking table for “overall competitiveness”, along with standardised scores for each province, is presented here.
Zooming in on Particular Provinces, focusing on Specific Environments
An analytical tool called the “Median Competitiveness Web” plots the scores of the province according to the 12 sub-environments in comparison with the median score generated from all 33 provinces. This way, one can easily see the performance of a particular
province in terms of specific sub-environments, in relation to the averageperforming province.

Here we show the Medium Competitiveness Web for Kepulauan Riau province based on official statistics for 2010 and ACI surveys conducted in 2012. We see that Kepulauan Riau, located just across the strait from Singapore, and includes Batam, Bintan, and
Karimun Islands, performs well above the median score for most of the 12 sub-environments. Openness to Trade and Services and Productivity Performance are notably high, which makes sense given the presence of industrial zones. However, subenvironments
related to Government and Institutional Settings have lower scores than the average. This could be due to the overlapping national, provincial and local regulations which account for some inefficiency on how different parts of the province are governed.
For comparison, we show the Median Competitiveness Web for Sulawesi Utara province. Sulawesi Utara is not very strong in terms of macroeconomics and business vibrancy. Its scores related to these are either the same as or slightly lower than the median
scores. This is understandable given the smaller size of the province. However, Sulawesi Utara scores quite well in terms of Government and Institutional Setting, which means that the currently weaker economy is somewhat compensated by having a well-performing
government.
At first blush, it appears a reduced economic vibrancy tends to lower complexity and hence a higher ease of governance. However, just like the case of Kepulauan Riau, a high score in some areas is not enough to pull up the overall competitiveness of the
province. More effort needs to be mobilised by each province to build on their strengths and improve on their weaknesses. One of the more useful aspects of the ACI study is in providing a map of such opportunities. Each province will then have specific
policy recommendations to improve their competitiveness.
Tan Khee Giap is Co-Director of Asia Competitiveness Institute Mulya Amri is Research Associate at Asia Competitiveness Institute, and PhD student at LKYSPP