This paper was co-authored by Dr Sonia Akter, previously Assistant Professor at the Lee Kuan Yew School of Public Policy, NUS (2022) and now Senior Lecturer, Crawford School of Public Policy, Australian National University; Dr Stuti Rawat, Department of Asian and Policy Studies (APS), The Education University of Hong Kong; and Mr Rijo P George.
Through the research, several interesting but vital factors define Singapore’s stronger resilience against global factors impacting other countries around the world in food security.
The current global food price shock and why it matters to Singapore
The global food price surge in 2022 was set off in the wake of the mass restrictions and lockdown measures introduced by governments worldwide to contain the spread of the Covid-19 pandemic. The ongoing conflict in Ukraine has further intensified the crisis with its concomitant disruptions to food, energy and agricultural input supply chains. These effects have been compounded by climate change induced extreme weather events. One of the world’s largest producers of wheat – China, is currently tackling its most severe drought on record , even as it declared its winter wheat crop to possibly be the ‘worst in history’ because of rare heavy rainfall in 2021 .
The combined impacts of the COVID-19 pandemic, climate change, and the Russia-Ukraine conflict on global food prices prompted many major food exporting countries to impose export bans on agricultural commodities in the interest of safeguarding domestic food security. For instance, between May to July 2022, India introduced a ban on wheat exports, imposed restrictions on the export of flour , Malaysia put curbs on poultry exports and Indonesia imposed a ban on the export of palm oil and its derivatives, before implementing a domestic market obligation for producers to sell a share of their product domestically at a set price .
These global developments are especially concerning for a country like Singapore given its heavy reliance on food-imports. More than 90 per cent of Singapore’s food is imported. Out of the annual food import of 1.6 million tonnes, 55 per cent arrives through sea and 40 per cent by road . Agriculture makes up less than 1 per cent of Singapore’s land use . In recent years, Singapore has focussed on boosting domestic food production through innovative measures, such as the promotion of urban agriculture, coastal fish farming, aquaculture, vertical farms and lab-grown meat. Despite that, local production meets only about 4 per cent of the city’s vegetable, 30 per cent of its eggs and 7.5 per cent of its seafood consumption needs .
How is Singapore weathering the current global food price crisis
Given Singapore’s high dependence on food-imports, it is expected that global developments of the last two years, such as the COVID-19 pandemic, the ban on food export, supply chain disruptions, would have had an adverse impact on domestic food markets in Singapore.
When we look at the data, this is indeed what we find. But what we also find is that rising food prices in Singapore are not emanating solely from the global food crisis. Food prices have been steadily rising in Singapore since 2007. We trace Singapore’ food price index from 2000 onwards, highlighting the periods of two major global food price shocks during this period: the food price crisis of 2007-08 ; and the current global food price crisis beginning from the Covid-19 lockdowns in March 2020 and the ongoing war in Ukraine (Figure 1).

Figure 1: Singapore’s food price index over time
Source: Based on data from the Singapore Department of StatisticsFigure 1 reveals two key points. First, since the food price crisis of 2007-08, food prices in Singapore have been steadily rising. Second, the impact of the ongoing global food price crisis on Singapore’s food prices is less than that was witnessed during 2007-08.
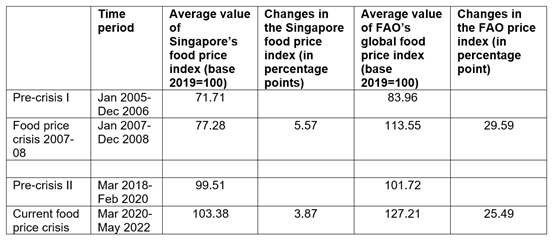
Quantifying the price rise in numbers, we see that between March 2020 to May 2022, the food price index in Singapore (2019=100) averaged 103.38, up 3.87 percentage points, relative to the two-year period before it. In contrast, during the food price crisis of 2007-08, between January 2007 to December 2008, the food price index in Singapore averaged 77.28, up 5.57 percentage points relative to the two-year period before it.
Although food prices have been rising in Singapore, especially since the food price crisis of 2007-08, in general they tend to be a lot more stable as compared to global food prices. This is apparent in Table 1 which compares the changes in the average value of the food price index in Singapore and globally, before the two crises. For both the crisis relative to the two-year period before it, the percentage point increase in prices in Singapore is far lower than that for world food prices.

Table 1: Average value of and changes to Singapore and FAO food price indices during food price crisis
Source: Singapore Department of Statistics and FAO
Notes: The FAO food price index (base 2014-2016=100) was rebased to the year 2019, however, it is not perfectly comparable to the Singapore food price index (base 2019=100) because of differences in the commodity basket compositionThe question then is, how is Singapore becoming better at insulating itself from global food crises? One reason could be Singapore’s growing economy.
The growing strength of the Singaporean economy
Figure 2 plots Singapore’s per capita GDP from 2000 to 2021 . The figure reveals an economy that has steadily been growing over time. Even during the pandemic years, there was an increase in per capita GDP, unlike during the food price crisis of 2007-08 and subsequent global financial crisis, when domestic per capita GDP contracted.

Figure 2: Singapore’s growing per capita GDP
Source: Based on data from the Singapore Department of Statistics
Singapore’s growing economy along with a relatively stable currency, may have contributed to higher purchasing power in the world market, thereby, providing a greater buffer towards global food price shocks. This is corroborated by previous research on global food price hikes which shows that per capita income appears to be a dominant factor that explains ‘pass through’ or the extent to which changes in world food prices lead to changes in local food prices . Studies agree that final consumers in high-income countries tend to experience a lower increase in local food prices as compared to those in low- and middle-income countries, in response to spikes in international food prices.
The commodities driving the current food price shock and public policies
Another reason that has tempered Singapore’s experience of the current food price crisis relative to the crisis of 2007-08 is the disparate composition of the commodities driving the two shocks. Figure 3 illustrates this by plotting the monthly Consumer Price Index (CPI) for different food groups from the year 2000 onwards. For the food price crisis of 2007-08, the price indices for oil and fats (in yellow), meat (in purple), bread and cereal (in blue) are higher than the food price index for all groups combined (in red).
In contrast, during the ongoing food price crisis, the food group which shows the highest increase in prices is vegetables (in black), followed by meat. Oil and fats continue to show variability in price movement, although the rise in their prices is not comparable to that during the 2007-08 food price crisis. Finally, the bread and cereals food group, which exhibited a stark price increase during the last shock, does not do the same during the current crisis.

Figure 3: Monthly CPI for food and food sub-groups presented semi-annually
Source: Based on data from Singapore Department of StatisticsThus, the two food groups that experienced a price surge during both the crises are – meat; and oils and fats, whereas bread and cereal prices behaved differently during the two crises. This can be attributed to the Singaporean diet, with rice rather than wheat being the primary staple cereal. During the food price crisis of 2007-08, rice was one of the food commodities that was significantly impacted, in contrast the current shock has impacted wheat the most. Since rice receives a higher weight in Singapore’s CPI than wheat, a rise in wheat price during the ongoing food price crisis does not affect Singapore’s food CPI as much as an increase in rice price did in 2007-08.
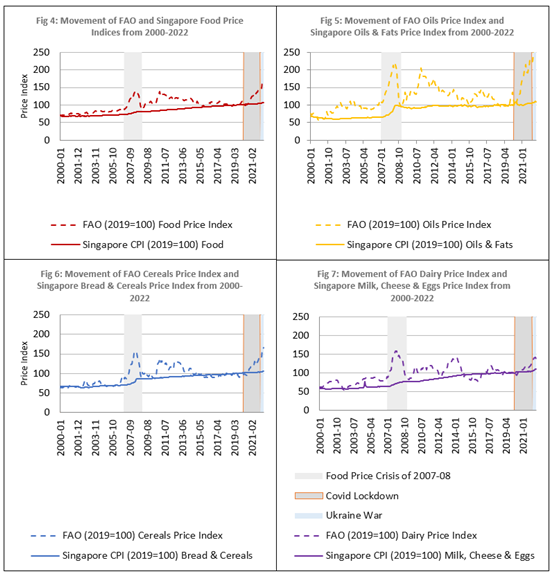
When we compare the price movement in Singapore’s food and food-group prices with global prices as determined by the FAO food price index (bearing in mind the caveat that the two are not perfectly comparable because of differences in the commodity basket composition); we find that on aggregate global food prices show much more volatility than food prices in Singapore (Figure 4). This trend is also observed in oil prices (Figure 5); cereals (Figure 6); and dairy products (Figure 7).

Singapore’s public policies which are geared towards food “self-reliance” (over self-sufficiency), have also played a role in ensuring greater domestic food price stability relative to world markets. Especially after the experience of the food price crisis of 2007-08, the government made concerted efforts to diversify food sources, not only among countries but also among zones within the countries, with major source countries tending to be those that show a surplus over domestic consumption and share strong ties with Singapore along with a mutual understanding of food security. A network of trade partnerships and Free Trade Agreements with several countries have helped in this regard. According to the Singapore Food Agency, Singapore currently imports food from more than 170 countries and regions in the world, thus reducing the risk of over-reliance on a single food supply source.
Another key policy measure has been the government’s emphasis on maintaining an essential food item stockpile of staples and proteins to withstand food supply chain disruptions. For instance, the Rice Stockpile Scheme requires rice importers to pre-commit to the quantity they would like to import and stockpile a prescribed amount (typically twice the import quantity) in a government designated warehouse. While ownership of the rice stockpile resides with the importer, during emergencies the government has the right to acquire the rice with compensation. If the rice stock is held in the warehouse for more than a year, the importer is required to replace it with a new stock. Details of the size of the stockpile typically remain undisclosed so as to not impact negotiations with suppliers and for the sake of national security. Maintaining a large stockpile helps to maintain a steady food price and avoids price surges during times of panic buying.
Thus, despite its high food import dependency and global food price shocks, Singapore has largely been able to maintain stability in its food prices, due to food availability rooted in the city state’s growing economic prowess, increased local production, diversification of food sources and stockpiling.